POLICY BRIEF: A Comparison of Living Standards Across the States of America

Introduction
While a vast literature has examined how living standards vary across countries, very little is known about how living standards vary within a given country. Living standards in U.S. states are often evaluated based on the states’ per capita income levels. States, however, differ along a number of dimensions that are likely to affect living standards: Per capita income levels range from $33,900 in Mississippi to $65,800 in Connecticut in 2015; consumption per capita varies by a factor of 1.7 across states; life expectancy at birth varies by almost seven years; and there are also substantial differences in educational attainment, in income inequality, and in the cost of living. All of these factors are likely to have large implications for the well-being of the population of a particular state. This policy brief makes two points based on the measure of living standards developed and discussed in Falcettoni and Nygaard (2020): 1) while the correlation between per capita income and living standards across the states of America is high, which suggests that a state’s per capita income level is a good indicator of its living standards, deviations between the two measures are often large; and 2) the correlation between the change in per capita income and the change in living standards is low, suggesting that growth rate in per capita income is a poor indicator of how fast living standards are improving in a particular state.
Falcettoni and Nygaard (2020) make the following points:
- Living standards and per capita income are positively correlated, but deviations between the two are often large.
- Living standards in most states appear closer to those in the richest states than a simple comparison of per capita income levels would suggest.
- High-income states benefit from higher life expectancy, consumption, and college attainment; low-income states benefit from lower cost of living.
- All states experienced positive improvements in living standards between 1999 and 2015.
- Deviations in the growth rate of living standards across the states are large, most of which is due to varying changes in life expectancy across the states.
- The growth rate in income per capita is only weakly correlated with the growth rate of living standards across states.
Comparison of living standards at a given point in time
Our measure of living standards extends the corresponding measure developed by Jones and Klenow (2016). Our measure of living standards accounts for cross-state variations in mortality, consumption, education, inequality, and cost of living. We decompose the difference in both the level and the growth of living standards across the United States into six components: life expectancy, college attainment, average spending, inequality, consumption good prices, and housing prices.
The output of the model is twofold: 1) a ranking of the states based on their level of living standards compared to the corresponding ranking of the states based on their per capita income levels; and 2) a ranking of the states based on their growth rate of living standards compared to the corresponding ranking of the states based on their growth rate of per capita income.
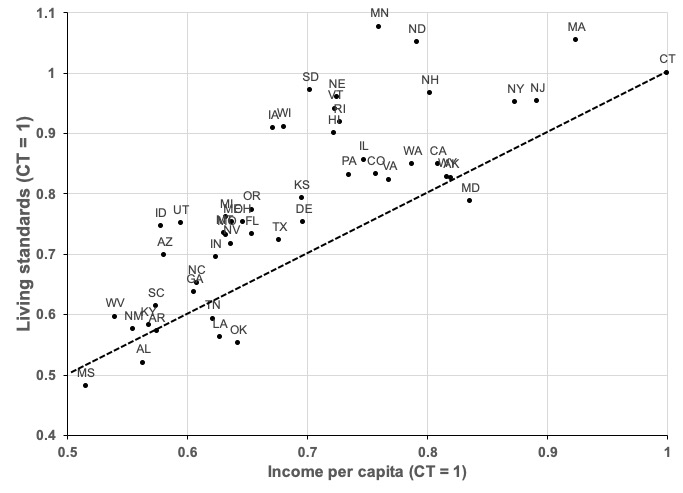
Exhibit 1 compares income per capita and living standards across the states of America in 2015. Both measures are indexed to Connecticut. The graph shows that living standards and per capita income are positively correlated with a correlation of 0.80. This shows that richer states tend to have higher living standards than poorer states. While living standards and per capita income are positively correlated, deviations between the two measures are often large. For instance, while a comparison of income per capita would suggest that living standards are 29.7 percent lower in South Dakota than in Connecticut, our measure shows that living standards are only 2.9 percent lower in South Dakota than in Connecticut. Similarly, although income per capita is 24.0 percent lower in Minnesota than in Connecticut, we find that living standards are 7.6 percent higher in Minnesota than in Connecticut. This follows because of higher life expectancy at birth, lower inequality, and lower cost of living in Minnesota than in Connecticut.
We find that living standards in most states appear closer to those in the richest state, Connecticut, than a simple comparison of per capita income levels would suggest. Living standards in several states in the South, however, appear lower relative to Connecticut than the difference in per capita income levels would indicate. As an example, while Oklahoma has 35.8 percent lower income per capita than Connecticut, we find that living standards are 44.8 percent lower in Oklahoma than in Connecticut. This follows because life expectancy at birth, consumption, and educational attainment are lower in Oklahoma than in Connecticut.
A comparison between high- and low-income states shows that living standards are higher in high-income states because of higher life expectancy, higher educational attainment, and higher consumption. The difference in living standards between high- and low-income states, however, is mitigated by the lower cost of living in low-income states. Therefore, failure to account for the heterogeneity in cost of living would lead one to overestimate the inequality in living standards between high- and low-income states.
Comparison of living standards over time
Exhibit 2 reports the top and bottom four states ranked according to their growth rate in living standards between 1999 and 2015.
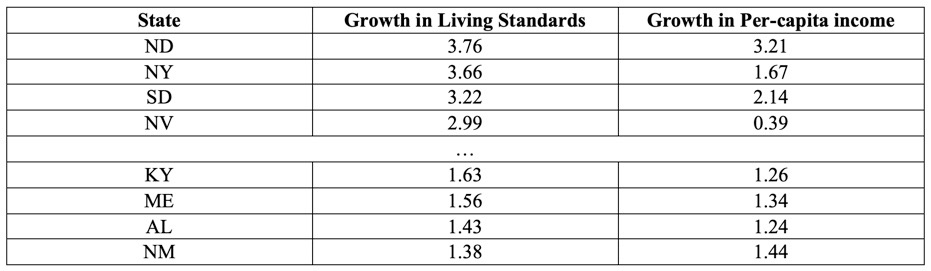
All states experienced positive growth in their living standards between 1999 and 2015, with a population-weighted average growth rate of 2.49 percent per year. North Dakota had the highest growth in living standards with an average growth rate of 3.76 percent per year over this period. In contrast, New Mexico had the lowest growth in living standards, with an average growth rate of 1.38 percent per year. To put this into perspective, this means that, under the current trends, living standards are expected to double every 18.4 years in North Dakota, compared to every 50.2 years in New Mexico.
The annual growth rate in living standards also displays great dispersion. A variance decomposition of the dispersion shows that variations in life expectancy gains alone account for 50.3 percent of the dispersion in welfare growth rates across states, while variations in college attainment gains and variations in spending growth are the other two main factors.
We find that the growth rate of per capita income and the growth rate of living standards are only weakly correlated, with a correlation of 0.38, and that deviations between the two measures are often large. This means that a low per capita income growth rate does not necessarily imply slow improvements in living standards. For example, income per capita increased by 0.39 percent per year in Nevada between 1999 and 2015, the lowest annual per capita income growth rate among all states over this time period. The corresponding increase in its living standards, however, was 2.99 percent per year. A ranking based on the growth rate of living standards places Nevada as the 4th highest-ranked state in the country. Accordingly, whereas the growth rate in income per capita would suggest that living standards barely increased in Nevada between 1999 and 2015, the growth rate in living standards shows that living standards increased considerably over this period. Similarly, whereas a number of states experienced comparable per capita income growth rates over this time period, their growth rates in living standards often differed substantially. Therefore, we argue that the growth rate of per capita income is a poor indicator of how fast living standards are improving in a particular state. These findings show that policymakers should be wary of evaluating the improvements in the well-being of the population of a given state based solely on its average per capita income growth rate.
References
- Falcettoni, E., and V. Nygaard (2020), “A comparison of living standards across the states of America,” working paper.
- Jones, C. I., and P. J. Klenow (2016), “Beyond GDP? Welfare across countries and time,” American Economic Review, 106: 2426–2457.