POLICY BRIEF: Understanding Retirement Income Risk

KEY POLICY INSIGHT: When workers are solely responsible for their own retirement income, the savings rate should be about 18%. Moreover, investment policy calls for high equity allocations during the early working years and relatively high bond allocations during retirement years.
Introduction
Pension systems (both defined benefit and defined contribution) make trade-offs between savings, investment, and retirement income. Effective pension policy design should consider the volatility of retirement income as well as average levels of retirement income. These points are especially relevant when evaluating changes in policies. This policy brief examines two important policy issues: (1) the price of guaranteed retirement income and (2) the choice of investment policy during working years.
Using a lifecycle portfolio choice model, a framework is built to compare two cases. In the first case, the worker is guaranteed a retirement income equal to roughly 45% of final pay. They must save (contribute) out of current income to augment their retirement income. In the second case, there is no guaranteed retirement income – all of retirement income must be financed out of savings during working life.
The framework illustrates the following points:
- Risk-taking in the investment portfolio decreases throughout working years
- The specific choice of a glidepath almost doesn’t matter
- Removing the guaranteed portion of retirement income results in the following:
- Average savings rates must double to keep retirement consumption unchanged
- Income during working years must increase around 15% to leave lifetime consumption unchanged
- Volatility in post-retirement consumption increases
These results identify key trade-offs for policymakers considering the design of current plans. First, incentives must be in place to encourage sufficient savings. Second, the results put a price on changing between systems. Third, the results offer guidance on default choices in defined contribution plans and aggregate risk-taking by defined benefit plans. Finally, the results highlight a potential role for annuities.
A Framework for Policy Evaluation
To evaluate pension policy choices, a benchmark is created using the lifecycle portfolio choice model developed by Cocco, Gomes, and Maenhout (2005). For the purposes of this framework, the yardstick for policy comparison is the impact on consumption through the lifecycle. More specifically, it is assumed that consumers work from age 20 to age 65. They are given a specific path for wage growth and wage volatility throughout the working life. During the lifecycle, they face a known distribution of mortality risk. To finance retirement, they can invest in a risk-free asset (whose real return is assumed to be 2%) or a risky asset. The risky asset has an assumed average real return of 6% with an annual standard deviation of returns of 16%. Thus, there are three sources of risk to the consumer: volatility in wage growth, volatility in equity returns, and mortality risk.
The output from the model is a path for lifetime consumption, savings during the working period, and investments throughout the lifecycle. In this framework, policymakers can affect savings choices and investment choices. For the purposes of this policy brief, the focus is on investment policies and the impact of alternative policies are evaluated by considering their impact on average consumption and the volatility of consumption in retirement.
This analysis considers two specific cases. In the first case, the worker is given a guaranteed retirement income equal to roughly 45% of final salary. They are agnostic as to the financing source of the guarantee. Higher rates of post-retirement consumption are financed out of savings during working years. This case is an approximate example of the current DB set up for public funds, where both workers and employers contribute to the pension system.
The second case is much simpler – it assumes that the worker doesn’t have a guaranteed source of retirement income. Thus, all retirement consumption is financed out of savings during the working life. This analysis aims to answer the following questions:
- Does the choice of specific investment policies make a difference?
- When the guaranteed retirement income is removed:
- What happens to savings rates?
- By how much does income need to go up to keep lifecycle consumption unchanged?
- What happens to consumption volatility during retirement?

Investment Policy – The Glidepath
In this framework, there is only one choice – the allocation between equity and risk-free assets. An important conclusion of this line of research is that the consumer should start with a high allocation to equity and reduce the allocation over time. In the parlance of the investment management industry, this relationship is called the glidepath.
Exhibit 1 compares the glidepath from the benchmark model with commercially available glidepaths. More specifically, the model-derived glidepaths is compared with the glidepaths embedded in the target date funds of Blackrock, Fidelity, and Vanguard.
All of the glidepaths in Exhibit 1 share the general pattern of reducing the allocation to the risky asset across the working life. However, there are some observable quantitative differences in the specific allocations across the lifecycle. The next two sections will explain why these differences are irrelevant for average consumption.
Savings Rates, Guarantees, and Consumption
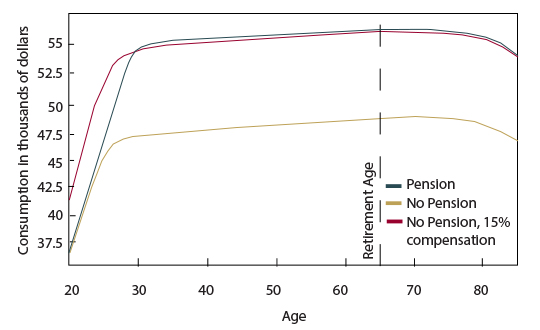
Exhibit 2 compares three paths for lifetime consumption. The first path is the average path under the base case scenario where the worker receives a guaranteed retirement income – the benchmark scenario. The second path is the path for consumption when the guaranteed retirement income is removed. As anticipated, because income hasn’t increased, the path for lifetime consumption is lower when the guaranteed retirement income is removed.
Now, suppose that income during working years is increased by 15%, and guaranteed retirement income is removed. The path for consumption under this scenario is the third path shown in Exhibit 2. The model shows that if guaranteed retirement income is removed, then salary must increase by 15% to keep the path of lifecycle consumption roughly unchanged.
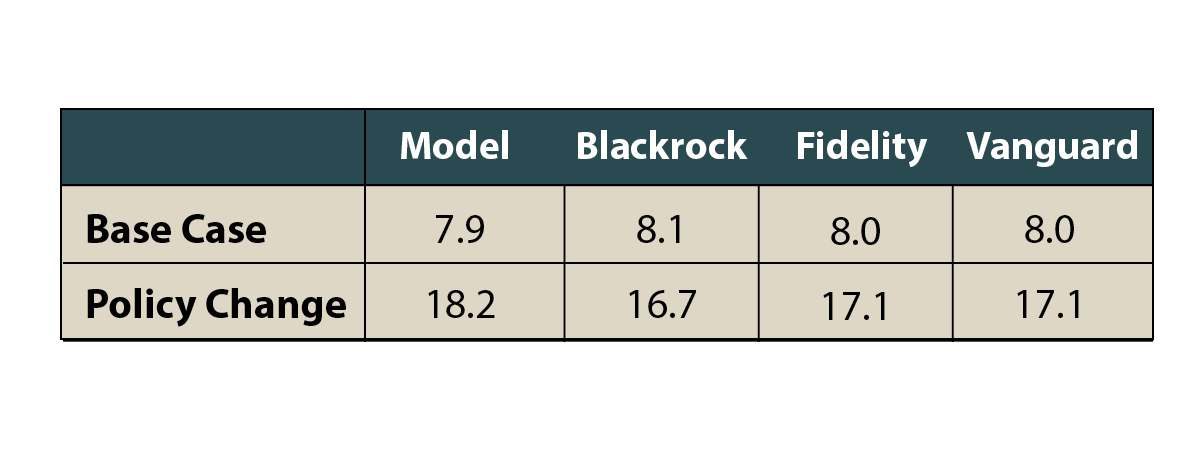
What about savings rates and investment policy? Exhibit 3 compares savings rates (percent of salary saved during working years) for the base case with a policy where the guaranteed retirement income is removed and income is increased by 15%. The exhibit also compares the effect on savings rates of alternative glidepaths. The first row in Exhibit 3 shows the savings rate under the base case, and the second shows savings rates with the alternative policy.
It is evident from the exhibit that, as measured by average savings rates, the choice of glidepath makes little difference. This conclusion is largely because all of the glidepaths start with high allocations to the risky asset and end with smaller allocations. It is also evident that when the guaranteed retirement income is removed, on average savings rates must at least double. The combination of a higher average savings rate and an increase in income produces a path for average consumption that is comparable to the base case consumption path.
Risks for Post-Retirement Income
The paths for consumption in Exhibit 2, and the savings rates in Exhibit 3 are averages across a large number of simulations. However, the design of social safety nets should also be concerned with the volatility of outcomes. More specifically, the volatility of retirement consumption should matter for pension policy.
The source of volatility in retirement consumption is financial market volatility. Financial market volatility affects the range of accumulated wealth during working years, and investment income during retirement.
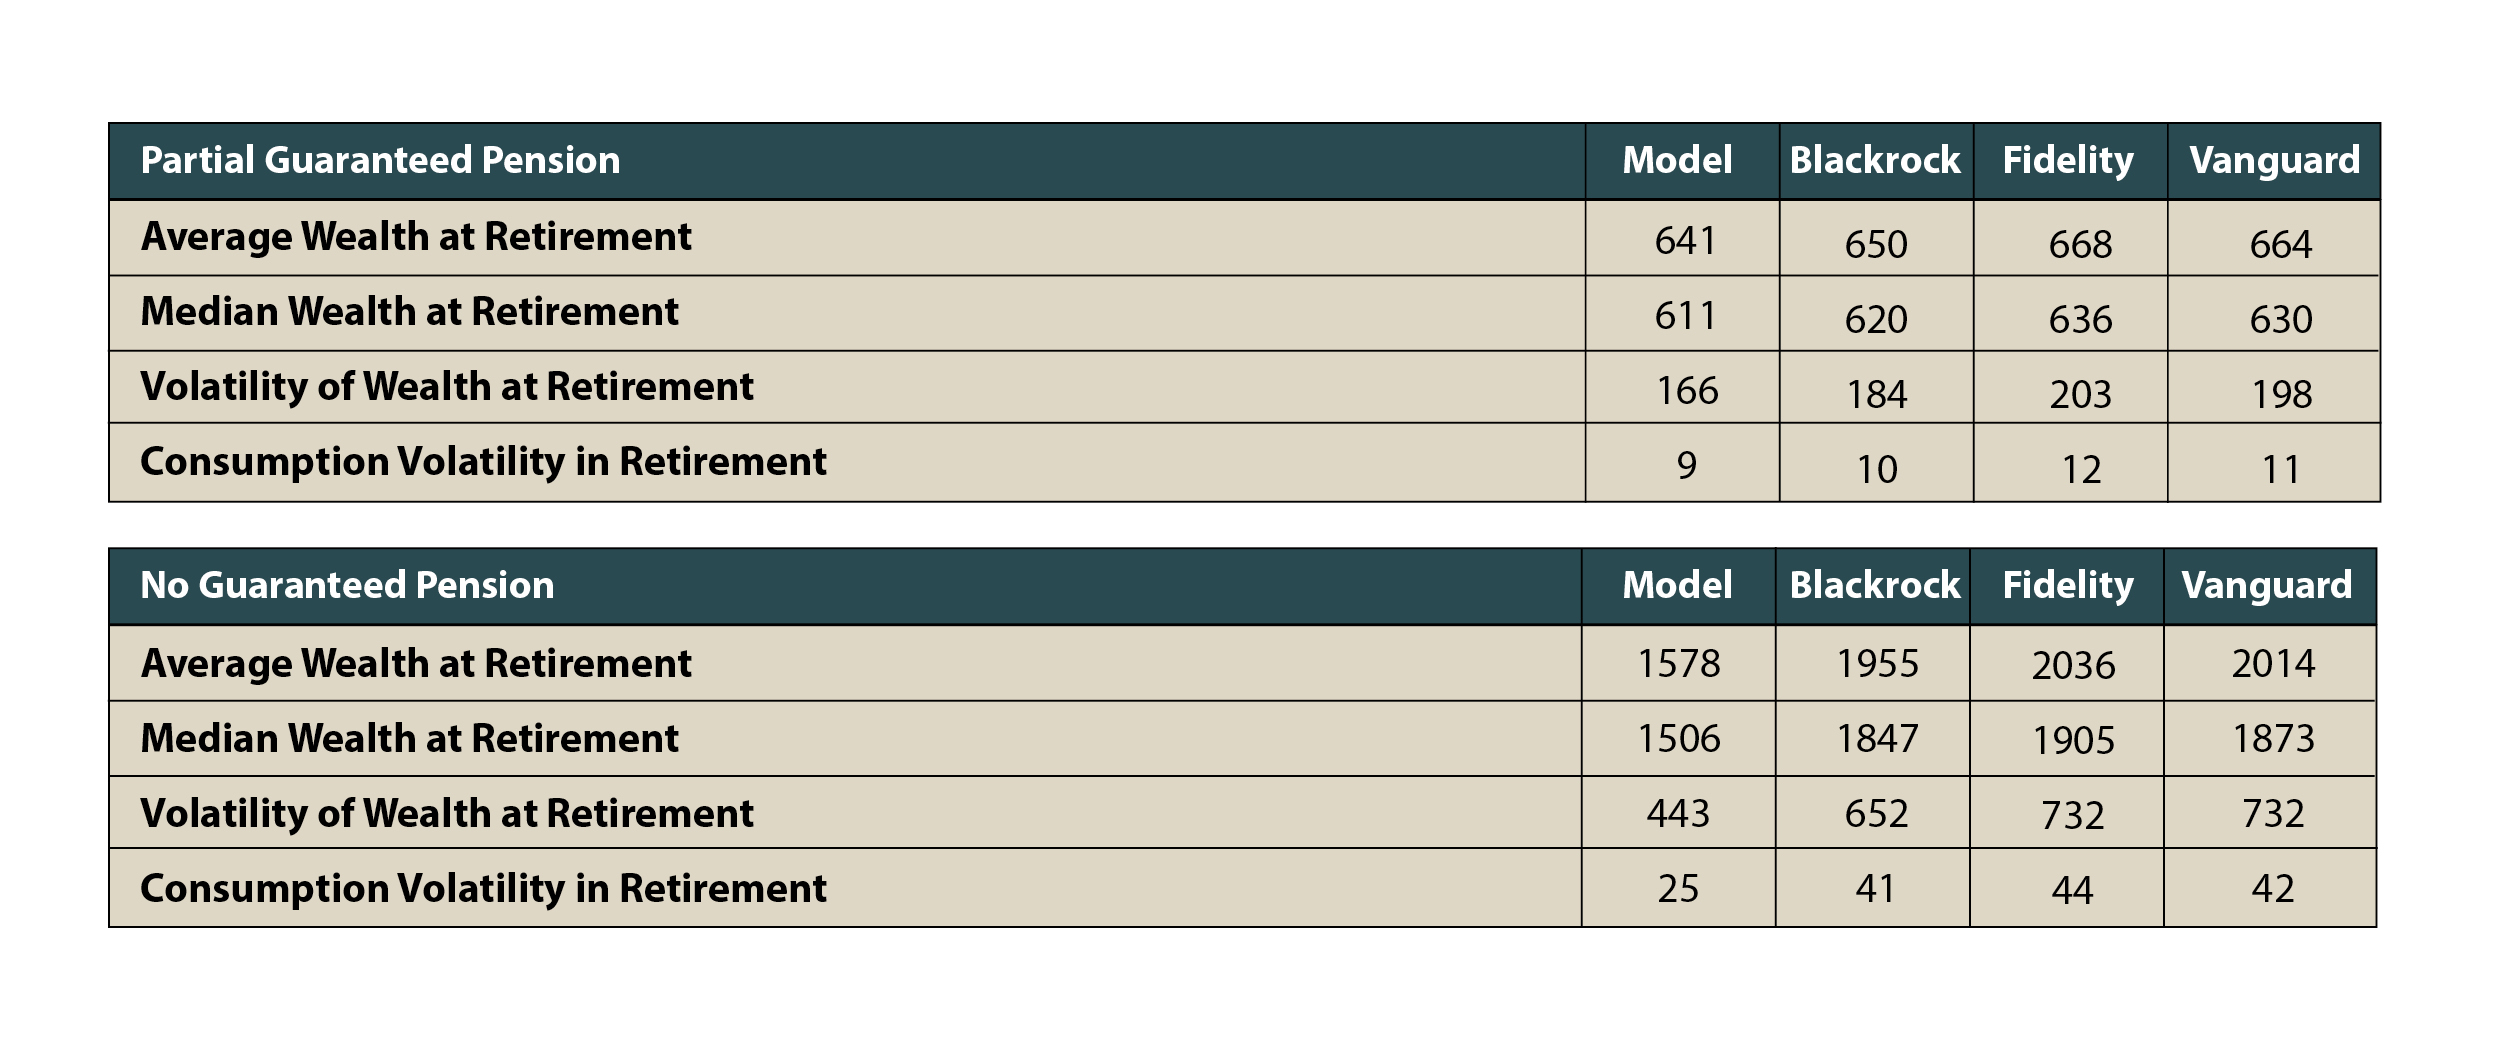
Exhibit 4 shows average wealth at retirement, volatility of wealth at retirement, and average volatility of consumption post-retirement for each of our cases and each of the glidepaths. The impact of the absence of a guarantee is evident from the exhibit. Average wealth at retirement is higher and more volatile when retirement income is entirely dependent upon accumulated financial wealth. And, retirement consumption is also more volatile when the guarantee is absent.
The results of the previous two sections make clear that a combination of higher savings rates, higher income during working life, and a glidepath for risky assets can reproduce the average benefits of some level of guaranteed retirement income. The results of this section suggest two additional considerations for policymakers. First, how should risk be managed and priced during the asset accumulation phase? And second, can volatility of retirement income be managed with financial products such as annuities?
Conclusions
Pension policy design incorporates guidance regarding savings rates and investment policy during working years and consumption during retirement years. Understanding these trade-offs is especially important in light of the continued transition to defined contribution pension systems.
This policy brief has shown that when workers are solely responsible for their own retirement income, the savings rate should be about 18%. Moreover, investment policy calls for high equity allocations during the early working years and relatively high bond allocations during retirement years. Importantly, the brief has also shown that several commercially available glidepaths are consistent with the broad framework of this brief.
Finally, this brief has shown that policymakers should consider the impact of increased volatility of wealth at retirement and consumption during retirement. These themes will be considered in future policy briefs.
Footnotes
(1) These models are useful because they explicitly evaluate tradeoffs between consumption and savings across time. Analysts can directly assess the impact on retirement consumption of changes in current savings policy.
(2) In the language of economists, this modeling approach is a partial equilibrium. That is, the consumer/worker is assumed to take as given the processes for wages and asset returns.
(3) Mortality rates can be looked up from government mortality tables. See National Center for Health Statistics (2016 dataset).
(4) Target date funds are commercially available mutual funds that automatically change the mix between bonds and a portfolio of risky assets (e.g. equity). The glidepath sources are:
- Blackrock: Lifepath Index Fund: https://www.blackrock.com/investing/resources/regulatory-docume…
- Fidelity: Fidelity Freedom Index Fund: https://www.fidelity.com/bin-public/060_www_fidelity_com/docume…
- Vanguard: Vanguard Target Retirement Fund: https://personal.vanguard.com/pdf/icrtdf.pdf