Revealing Public History Through Maps
Data is not only for STEM scholars. In HIST 3001–Public History, Associate Professor Tracey Deutsch, and Post-doctoral Associate Andre Kobayashi Deckrow, helped their undergraduate students team up with the Mapping Prejudice Project to digitize mapping data from Minnesotan history.
Students in the course went through hundreds of addresses from members of the National Association for the Advancement of Colored People (NAACP), taken from archives in the Library of Congress. Then, they placed them onto a map to form a tangible picture of how events like highway construction and racialized policies displace marginalized groups of people. Public history is part of the University of Minnesota’s community-engaged learning program, which integrates community work with studies.
“These undergrads are really on the cutting edge in terms of creating a resource [that] can be used for all kinds of people who want to understand the history of civil rights and Minnesota,” says Kirsten Delegard, public historian and project founder of Mapping Prejudice. “That is going beyond this class.”
Using Data to Understand History
The Mapping Prejudice Project began in 2016 at the UMN Library when Delegard, along with her co-founders Penny Petersen, Ryan Mattke, and Kevin Ehrman-Solberg, had the idea to map out racial covenants in Minneapolis. These covenants were clauses in property records that prevented non-White people from being able to purchase or occupy land. The team created a digital platform that brought on volunteers from the community to search for these. It was a big undertaking with decades of public records to go through in multiple counties. It totaled up to millions of pages.
“To really get people to reframe the racial disparities that we are living with today, and to understand that they were deliberately constructed through policies and structural racism, that was the impetus behind Mapping Prejudice,” Delegard says.
The scope of Mapping Prejudice has only grown since then, extending outside of their starting place in Hennepin County to other areas in and around Minnesota. Members search through public records, identifying places that have racial restrictions in them. They then invite thousands of volunteers to come look at them and identify any racial covenants within them. Mapping Prejudice intends to highlight the places with these discriminatory clauses to raise awareness of unjust practices and digitize the data to make the information more accessible to others.
“I think it's really a testament to how much work the Mapping Prejudice Project does. They've done such a good job with looking at housing covenants, and now they're starting to look at other ways that other types of data can address inequality and issues of racial justice as well,” Deckrow says.
In addition to uncovering racist policies, the Mapping Prejudice Project has other means of looking at inequality in data, such as mapping the movement of NAACP members. This is where the public history students come in.
The Narrative of a Map
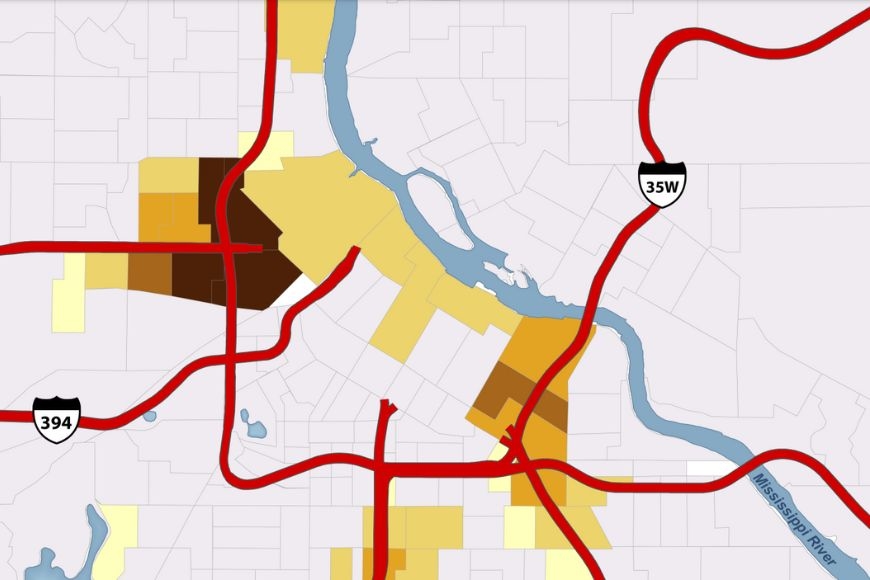
The students worked with Mapping Prejudice for half of the semester to compile their own data. They teamed up with a member of Mapping Prejudice to input hundreds of addresses of NAACP members into a dataset that would be used to create a story map, a digital tool linked to ArcGIS that integrates history with geography. These maps show where members are and how they moved throughout time, along with historical research to explain the data. Their focus was on the Twin Cities freeway construction in the 1950s and 60s, using map data to get a clearer view on how populations changed during the building of the highway.
Alan Crenshaw, one of the students involved with the mapping project, says, “we were trying to see what effect highway construction had on Black activism in the Twin Cities throughout the 20th century using NAACP membership as a kind of proxy. I-35W and I-94 really decimated some areas that were key to the civil rights struggles in the Twin Cities, and it’s hard not to think that this was intentional.”
Having visual data can go a long way in revealing the bigger picture. The Rondo neighborhood, a predominantly Black community in St. Paul, got torn apart when plans for the I-94 highway went right through it. This displaced many residents from their former homes, and the story map showed the number of NAACP members who had cleared the area when the highway was being built. Seeing the movements of people and the reasons behind it can reveal larger patterns to those being introduced to Minneapolis history for the first time. It is especially meaningful to those who have lived in and around the Twin Cities, like Crenshaw.
“[Maps] excel at conveying complex information and narratives in digestible ways. It’s much more visceral to know a place and see it represented in a new way,” he says.
The Importance of Digitizing Data
By creating a story map, students are not only using it to supplement their own understanding of public history, but others’ understandings too. The dataset they created will be available to the public to view, giving it even more purpose in the future. The students’ mapping project will also show the way data can be used beyond mathematics and science. It’s a useful tool for public historians to analyze history, and be able to show how events and policies affect populations of people in a tangible way.
“Data is very essential and can help projects be very persuasive,” says Deckrow. “To the untrained eye, these just look like a list of addresses and names, but when you put all of these things together, it can tell a very powerful story. And that's what we hope to do.”
The HIST 3001 Public History course is available to take for Fall 2023.
By Lily Zenner
This story was written by an undergraduate student in CLA.